Operation Feedback
Operations can provide a variety of forms of real-time feedback including subplots, 2D and 3D plots and images using matplotlib.
Graphs
The following example shows a sample 3D scatter plot and its rendering in DeepForge.
import matplotlib.pyplot as plt
import numpy as np
from mpl_toolkits.mplot3d import Axes3D

class Scatter3DPlots():

    def execute(self):
        # Set random seed for reproducibility
        np.random.seed(19680801)


        def randrange(n, vmin, vmax):
            '''
            Helper function to make an array of random numbers having shape (n, )
            with each number distributed Uniform(vmin, vmax).
            '''
            return (vmax - vmin)*np.random.rand(n) + vmin

        fig = plt.figure()
        ax = fig.add_subplot(111, projection='3d')

        n = 100

        # For each set of style and range settings, plot n random points in the box
        # defined by x in [23, 32], y in [0, 100], z in [zlow, zhigh].
        for m, zlow, zhigh in [('o', -50, -25), ('^', -30, -5)]:
            xs = randrange(n, 23, 32)
            ys = randrange(n, 0, 100)
            zs = randrange(n, zlow, zhigh)
            ax.scatter(xs, ys, zs, marker=m)

        ax.set_xlabel('X Label')
        ax.set_ylabel('Y Label')
        ax.set_zlabel('Z Label')
        plt.show()
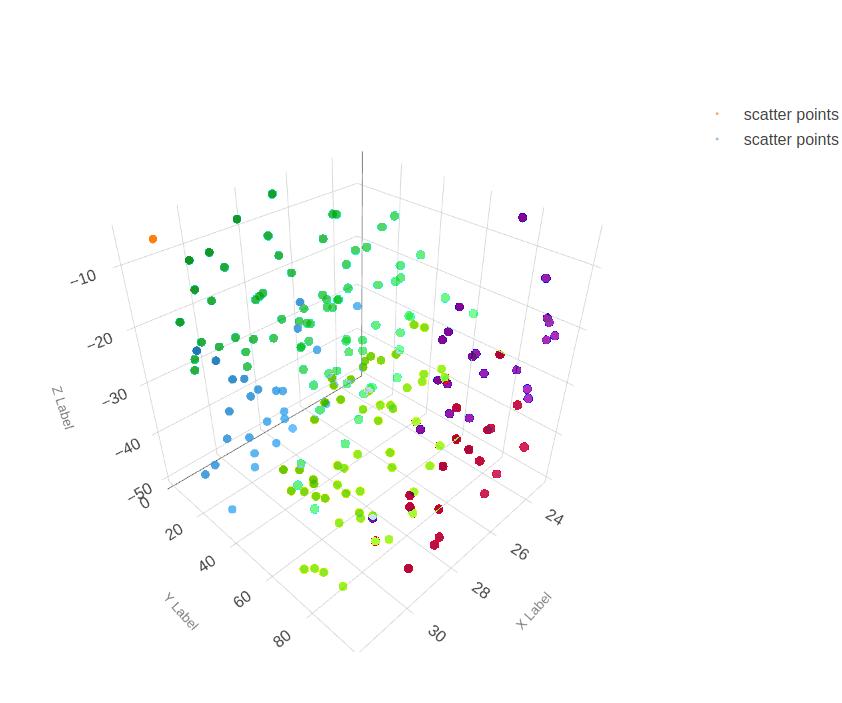
Example of a 3D scatter plot using matplotlib in DeepForge
Images
Visualizing images using matplotlib is also supported. The following example shows images from the MNIST fashion dataset.
from matplotlib import pyplot
from keras.datasets import fashion_mnist

class MnistFashion():

    def execute(self):

        (trainX, trainy), (testX, testy) = fashion_mnist.load_data()
        # summarize loaded dataset
        print('Train: X=%s, y=%s' % (trainX.shape, trainy.shape))
        print('Test: X=%s, y=%s' % (testX.shape, testy.shape))
        for i in range(9):
            pyplot.subplot(330 + 1 + i)  # define subplot
            pyplot.imshow(trainX[i], cmap=pyplot.get_cmap('gray'))  # plot raw pixel data
        pyplot.show()
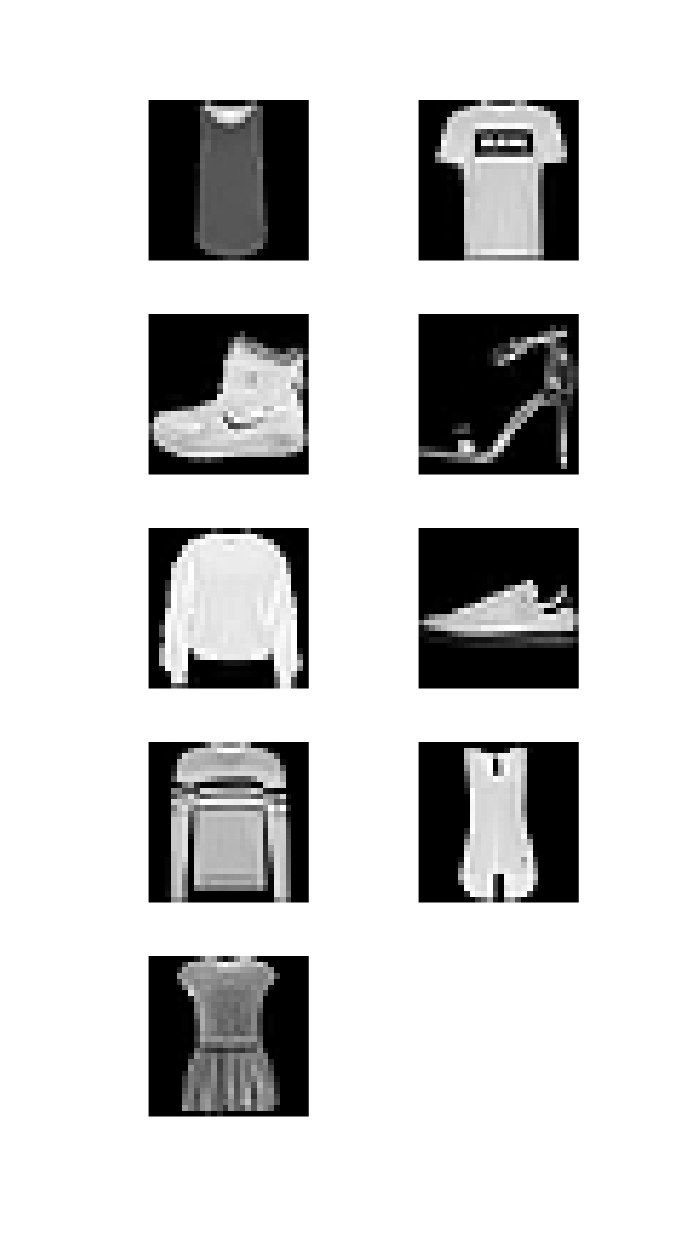
Visualizing MNIST fashion images in DeepForge